How to export your TPT data
For the most reliable first snapshot, upload Keyword Stats, Product Insights, Traffic Data, and My Product Stats together. Use the same recent date range for the first three, and keep the full list in My Product Stats. Revenue adds helpful store-level financial context. You can still start with fewer files; Signal Loom will show what it can read. Click any file below to see where to find it and what to watch out for. None of these files contain any personal data of yourself or your buyers.
1Keyword StatsKeywordStats.csvPowers keyword scoring, intent signals, and trend comparisons. One of four strongly recommended files for a reliable first snapshot.
▼
KeywordStats.csvPowers keyword scoring, intent signals, and trend comparisons. One of four strongly recommended files for a reliable first snapshot.
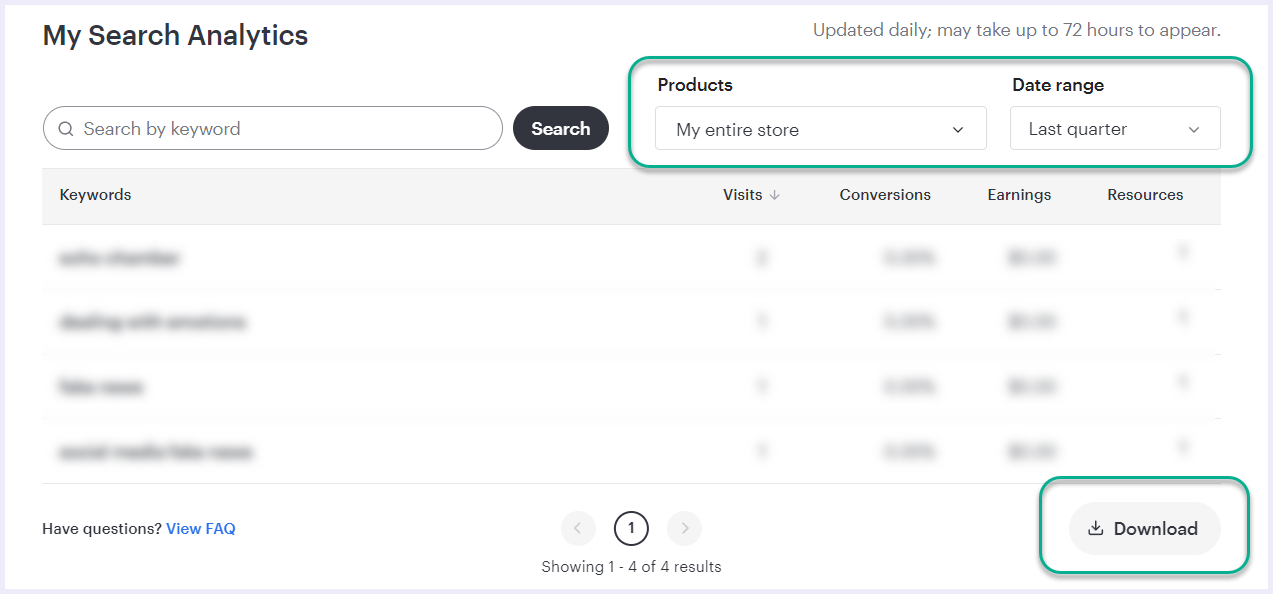
Click the button above to go directly to your TPT Dashboard → My Search Analytics page. Leave the Products filter on My entire store unless you want to analyze only specific products. Click on the Date range dropdown and set a date range. We recommend the last 3 months or last quarter, as it gives the most useful signals. Press Save at the bottom right of the Date range.
Then download the CSV with the Download button at the bottom right of the page.
2Traffic DataTrafficData.csvShows where your visits come from: TPT search, external search, social, and more. One of four strongly recommended files for a reliable first snapshot.
▼
TrafficData.csvShows where your visits come from: TPT search, external search, social, and more. One of four strongly recommended files for a reliable first snapshot.
Click the button above to go directly to your TPT Dashboard → Traffic page. Set a date range. We recommend the last 3 months or last quarter, as it gives the most useful signals. Press Save.
Then download the CSV from the Download Data button on the right of the page.

3Product InsightsProductInsights.csvViews, units sold, conversion rate, and earnings per product. One of four strongly recommended files for a reliable first snapshot, and also powers product trend comparisons.
▼
ProductInsights.csvViews, units sold, conversion rate, and earnings per product. One of four strongly recommended files for a reliable first snapshot, and also powers product trend comparisons.
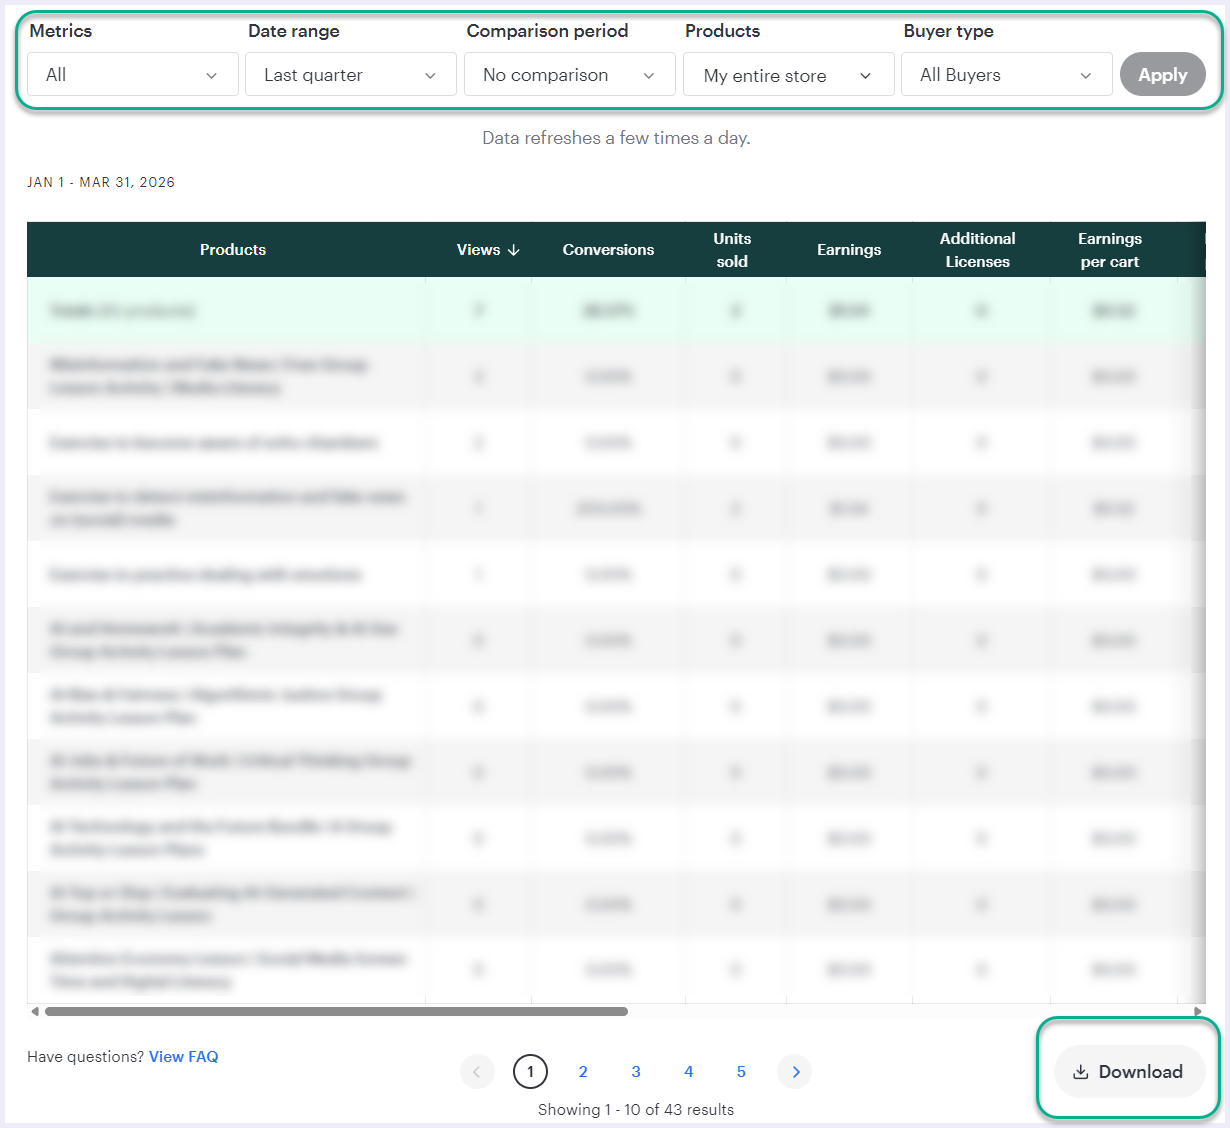
Click the button above to go directly to your TPT Dashboard → Product Insights page. Select all metrics, press Save. Set a date range. We recommend the last 3 months or last quarter, as it gives the most useful signals. Press Save. Keep Comparison period on No comparison. Signal Loom handles its own comparisons. Keep Products on My entire store unless you want to analyze only specific products. Keep Buyer type on All Buyers. Press Apply. Your chart updates.
Then download the CSV from the Download button at the bottom right of the page.
4My Product StatsMyProductStats.csvLifecycle data per product: posted date, previews, downloads, ratings, and more. It helps Signal Loom read product performance—including free resources—more carefully.
▼
MyProductStats.csvLifecycle data per product: posted date, previews, downloads, ratings, and more. It helps Signal Loom read product performance—including free resources—more carefully.
Click the button above to go directly to your TPT Product Statistics page. Keep everything as-is. Signal Loom expects the full list.
Then download the CSV from the Download link on the top right of the page.

5Revenuerevenue.csvCurrent month and year-to-date revenue summary. Used for financial signals; no date range picker.
▼
revenue.csvCurrent month and year-to-date revenue summary. Used for financial signals; no date range picker.
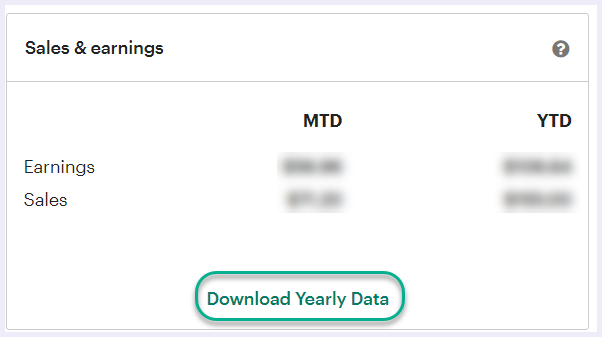
Click the button above to go directly to your TPT Dashboard main page. Scroll down and in the Sales & earnings section click Download Yearly Data. TPT currently exports month-to-date and year-to-date values, with no date range picker. Signal Loom uses it for financial context, not trend comparisons.
Choose a useful date range
TPT lets you set a date range before downloading. This affects the quality of your analysis, not just Trends.
- For general analysis: Last 3 months or Last quarter gives the most useful signals. It reflects what is happening now, without old data diluting the picture.
- For Pro Trends: Download KeywordStats.csv and ProductInsights.csv again for a second date range. If your first upload was the latest 3 months, export the 3 months before that next.
- All time exports average patterns across years. A keyword that was active in 2022 but is now flat will still show visits, making it harder to spot what is actually working today.
🔒 Getting trend comparisons
Signal Loom has a Pro tier that can show you what changed between two periods: growing keywords, product movement, revenue shifts. To get clean trend data, upload the same CSV export types for two different date ranges.
- 1. Download KeywordStats.csv and ProductInsights.csv together. Get both, every time, for keyword and product trends together. They live on separate TPT dashboard tabs with their own date pickers, so re-set the same date range by hand on each one before downloading. Signal Loom can still compare periods that don't line up exactly, but a matching range gives the clearest comparison.
- 2. Upload those files as one batch. Signal Loom detects the period and saves it.
- 3. Go back to TPT for your comparison period. When you're ready to see what changed, download KeywordStats.csv and ProductInsights.csv again, this time for a different date range (the 3 months before your last upload works well), and upload those too.
Non-overlapping periods (last quarter vs this quarter, or last month vs this month) give the cleanest comparison. Keep the period consistent across file types.